Panel plot of histogram and density curve
Prints the histogram and corresponding density curve
panel.hist(x, col.bar = "gray", ...)
Arguments
| x | a numeric vector of x values |
|---|---|
| col.bar | the color of the bars |
| ... | options passed to hist |
Details
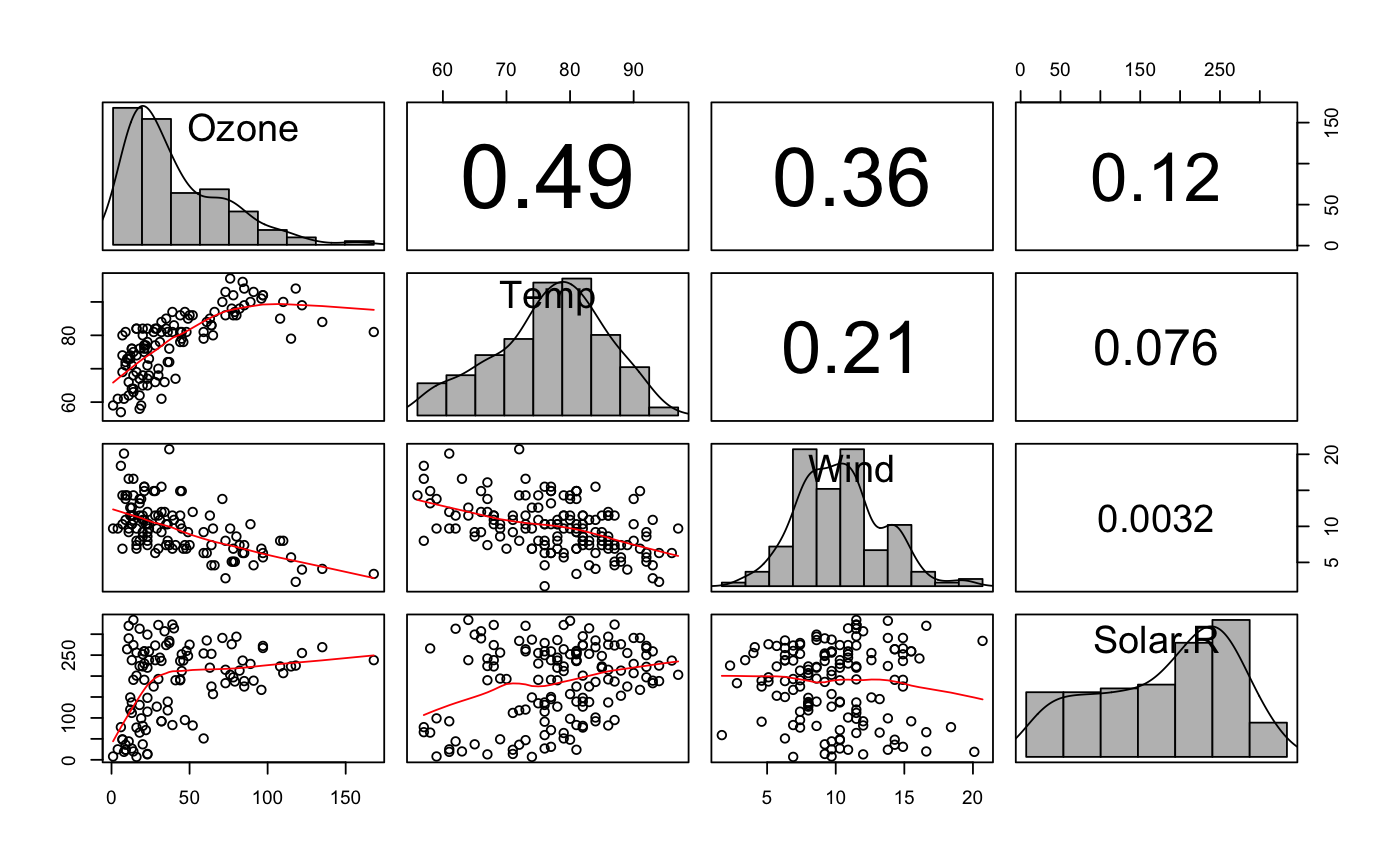
This function prints a combined histogram and density curve for use with the pairs function
References
Ekstrom, CT (2011) The R Primer.
Examples
pairs(~ Ozone + Temp + Wind + Solar.R, data=airquality,
      lower.panel=panel.smooth, diag.panel=panel.hist,
      upper.panel=panel.r2)